Dashboard
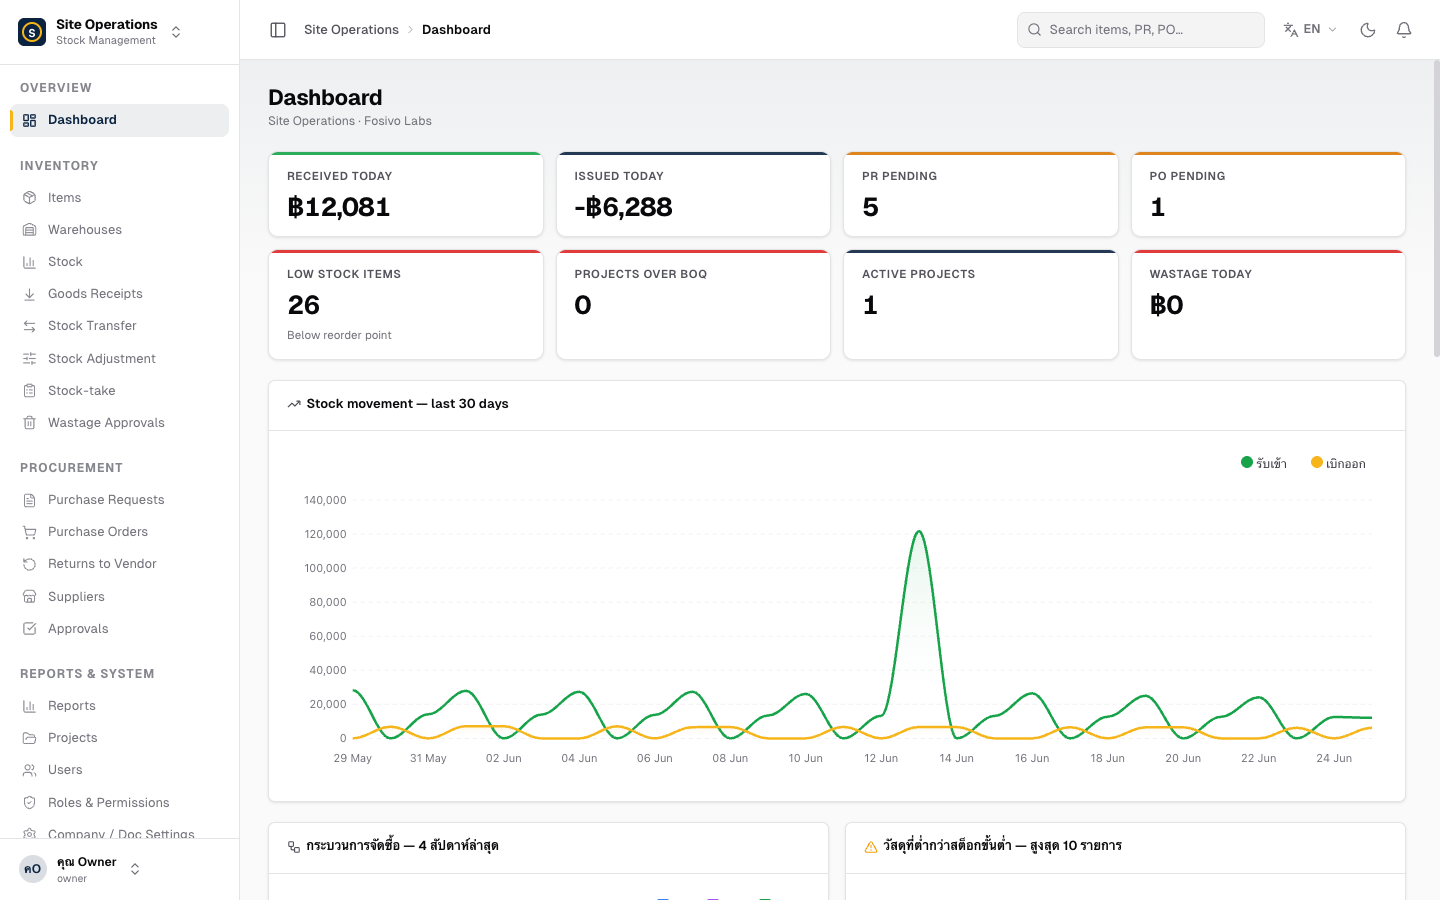
The dashboard is the first screen you see after signing in. It brings together key figures and charts in one place so you can make decisions immediately.
KPI Cards
Section titled “KPI Cards”The top row displays a summary of today’s activity.
| Card | What it shows |
|---|---|
| Received Today | Number of GR entries recorded today |
| Issued Today | Number of transfers or withdrawals that occurred today |
| PRs Pending Approval | Purchase Requests awaiting an approver — click to view the list |
| POs Pending Approval | Purchase Orders awaiting approval |
| Low Stock Items | Number of items whose stock has fallen below the minimum level |
| Active Projects | Projects currently in “In Progress” status |
30-Day Stock Movement Chart
Section titled “30-Day Stock Movement Chart”The lower section displays a line chart comparing Received vs. Issued over the past 30 days. This helps you spot material usage trends and plan orders in advance.
- Green line — total stock received into the warehouse
- Orange line — total stock issued or transferred out
How to Use the Dashboard
Section titled “How to Use the Dashboard”- Sign in → the system takes you to the dashboard automatically
- Check the PRs / POs Pending Approval cards first thing each morning
- Click the Low Stock Items card to see what needs to be reordered
- Review the 30-day chart to estimate material demand for the upcoming period